By Zach Broeren
[Cover image credit: Peter R. Broeren]
It’s no secret to anyone that has visited any college campus, let alone Denison, that college-aged people are more inclined to hold liberal political beliefs. This can be found everywhere on campus, especially in campus organizations, with more liberal/left-leaning organizations such as Refugee Advocacy Collective, Denison Democrats, and Denisonians for Planned Parenthood, while right-leaning organizations are mostly limited to the College Republicans and Denison Libertarians. Many people have vague ideas about what they think the partisan makeup is at Denison, but what is the true partisan makeup on Denison’s campus and how deeply are they divided in politics? In the March 2021 survey, respondents chose one of 8 options to define how they stood politically, ranging from Strong Democrat to Strong Republican with an 8th option of “other.”

It is no surprise that a majority of Denison students have a Democratic leaning. 68.9% of Denison Students have some left leaning, whether that is Strong Democrat, Democrat, or Independent but lean Democrat. Republicans make up a much smaller percentage, where only 18.3% of Denison students are Strong Republican, Republican, or Independent but lean Republican. Independents make up 12.8% of Denison’s campus.
However, these labels say little about how each group feels. What constitutes a Strong Democrat’s position in politics or Strong Republican’s position may vary between persons and there are more ways to look at how each group shapes up. One of these ways is presidential approval and in the March 2021 survey respondents were asked whether they approved or disapproved of President Joe Biden.

It’s very interesting that the highest support of Biden did not come from Strong Democrats, but rather from those who answered plain Democrat. 89.2% of those who answered Democrat approved of President Biden, while only 67.4% of those who answered Strong Democrat approved of President Biden. One reason for this is that Biden may be considered more a moderate Democrat, which would drive those who are stronger Democrats to moderate their support, since it may seem like to them that he is not doing enough. Another answer for this may lie in a deeper understanding of who “Strong Democrats” and “Democrats” are. A past 127 writer, Jacob Dennen, found that Strong Democrats were 22.7% Progressive and 41.4% Liberal, while “Democrats” were just 12.1% Progressive and 61.4% Liberal. As such, there may be an ideological difference between Democrats and Strong Democrats that drives differing approval ratings. On the other end of the spectrum, only 9.1% of Strong Republicans approved of President Biden (which for the record was 1 out of the 11 people in the survey who chose Strong Republican).
Another way to see how Denison groups are divided internally is to see if they inversely feel the same way about a different political candidate. In the March 2021 survey, respondents were asked whether or not they approved of Donald Trump, which 127 has examined before.
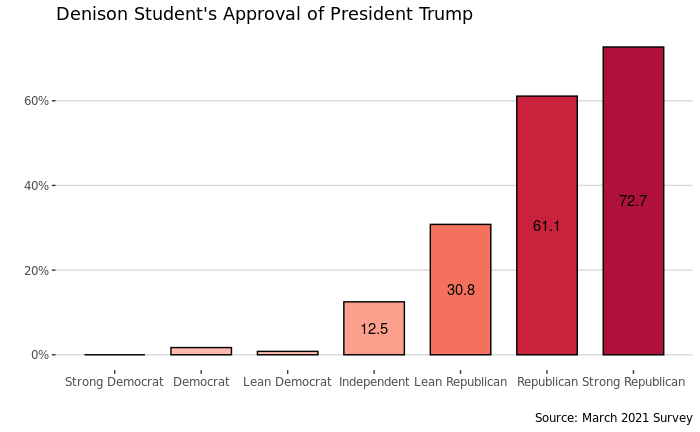
Overall, Trump received significantly less support across the board, with only 10% of Denison Students approving of Trump, and unsurprisingly those who agree with Trump are more likely to approve of his job as President. Strong Republicans were the most supportive of President Trump, where 72.7% of those who answered Strong Republican approved. Those who leaned Democratic had horrendous support for President Trump; 0.8% of those who identified as independent but lean Democrat approve of Trump (which was 1 out of 122) and 1.7% of those who answered Democrat approve of Trump (2 out of 120). A whopping 0.0% (0 out of 86) of people who selected Strong Democrat approved of Trump’s Presidency.
Denison students are very divided on how they feel about President Biden and Trump, but do they have the same interest in politics? Denison students were asked to rate on a scale of “Not interest at all” to “Extremely interested” of how interested they have been in US politics in the past year, with higher scores indicating higher interest.

Students who were more polarized on average chose that they were more interested in politics, while those who leaned independent or were independent were not nearly as interested in politics. However, only some of these results are significant. For example, Strong Democrats have significantly higher interest than every other group except for Strong Republicans. Independents, those who lean Republican, Republicans, and Strong Republicans are not significantly different from each other and average about “term” interest. Either way, it is quite interesting to see the almost horseshoe effect occurring between the right and the left.
While this evidence most likely confirms every hunch you had about college students, it’s neat to put definitive numbers to the data. I’ve heard many different guesses on what percentage of our campus was leaning Democratic, anywhere from 50% to 70% all the way to 100% from those who listened to Rush Limbaugh in my hometown. Same thing goes for approval of President Trump and Biden; everyone knows that you are more likely to get support from your own party and the lower support that Biden received from Strong Democrats vs Democrats may be indicative of a larger ideological shift within the party. It also makes quite a bit of sense that those who describe themselves as stronger one way or the other are more likely to find politics important in their lives than being apathetic.
Zach Broeren, a Junior at Denison University majoring in Political Science, is now starting to figure out too late he probably should have majored in Data Analytics.
