By Oliver Gladfelter
We know about 76% of campus voted for Clinton, 11.5% voted for Trump, and others split between Johnson, Stein, and opting out of voting. We also know that Denison students voted in record numbers, at over 93% of registered voters. But we can dig even deeper and look at exactly which students voted for whom. A good guess is that Democrats voted for Clinton and Republicans voted for Trump. But with two historically unpopular candidates, was this necessarily the case? If there’s ever an election in which people were willing to cross party lines, it would have to be the presidential election of 2016. But if so, who was most likely to do so?
Did people jump ship?
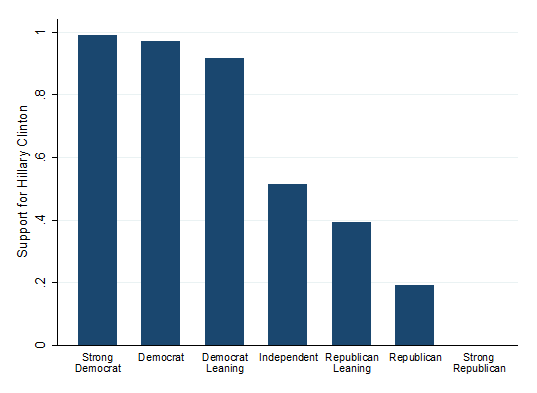
Ideology and party identification are always the strongest predictors of how someone will vote, but was this true this year? Over 91% of Democrats supported Clinton, which is no surprise. On the other side, 39.1% of Republican-leaning independents and 19.2% of Republicans indicated they were voting for Clinton. There were no strong Republican students who were willing to vote for Clinton. Democratic support for Trump was nonexistent on Denison’s campus and only 2.5% of independents supported him. Thus, a decent amount of Republicans ditched their party for Clinton, but Trump was unable to convince any Democratic students to do the same for him.
| Figure 1 – 23.7% of Republicans or Republican Leaning Independents Voted for Clinton
|
Voting against your party is no light decision to be made, especially considering the strong hold partisanship has on voters. The Republican students definitely would have their reasons. One of these reasons would be Social Dominance Orientation (SDO), which is the feeling that it is right that certain groups in society are dominant and that we need not strive for group equality. As it turns out, Republicans have much higher SDO than Democrats.
| Figure 2 – SDO Rises As Party ID Moves More Republican
|

We measure SDO on a scale from 0 to 1, 0 being the least SDO-inclined, 1 being the most. While the all-campus average is only .26, it varies a lot by party – Democrats averaged .19, independents averaged a .36, and Republicans averaged a .46. These are in line with national figures (see note 1).
Variation does exist within the parties, however, and this variation is key to guessing which Republicans may have been more willing to reject their own party’s nominee. 36.7% of Republican students who scored a less-than-average SDO voted for Clinton. On the other hand, only 19.3% of Republicans with a greater-than-average SDO voted for Clinton. SDO has a big effect on how someone will vote in any election, yet in the 2016 presidential election, it may have been the difference between voting Trump or voting Clinton.
One might suspect that many of the Republicans who voted for Clinton were women. Throughout the course of the election, both women’s and LGTBQ rights were on the line. With Trump’s anti-abortion positions, Mike Pence’s history of anti-LGTBQ stances, and a vacant seat in the Supreme Court, there was a lot at stake for these communities. For these reasons, one might expect to see bigly more Republican women than men crossing party lines, however this was not the case. 95.9% of Democratic women voted for Clinton, which is about the same rate as Democratic men (93.3%). We expected the real gender gap within the Republican party. Yet although 24.2% of Republican women voted for Clinton, this is only 1 percentage point greater than the amount of Republican men voting for Clinton (23.1%). The only visible gender gap is among independent students (46.9% males vs 61.5% females voting for Clinton) (see note 2).
| Figure 3 – Within Parties (no, not the Sunnies), Males and Females Voted for Clinton at (Statistically) the Same Rate
|

Finally, student’s attitudes toward the US political system and outsiders affected how votes fell. One question of the survey asked students to agree or disagree with the following sentiment: “The US needs a political outsider to fix its broken political system.” Predictably, students agreeing with the need for political outsiders were less likely to vote for Clinton. Even for Democrats, 99% of those who disagreed voted for Clinton, yet this dropped to 93% for those who neither agreed nor disagreed, and fell even further to 86% for students who agreed with the statement. On the Republican side, just over a third who did not agree with that statement voted for Clinton, which decreased to 7.8% among those who agreed with the need for an outsider.
Shifting Support from the Primaries to the General
Students who supported Clinton and Trump in the primaries overwhelmingly held their support through the general election (100% of Clinton’s supporters, 96% of Trump’s – see Table 1). But what about students whose preferred candidate lost in the primary?
Once it became clear Sanders would not be the Democratic nominee for president, it was not abundantly clear if his supporters would stay with the Democratic party – Trump, Johnson, and Stein all made bids for his supporters. And because 45% of students supported Sanders, there were plenty of young voters to fight for.
So who did Denison’s “Bernie Bros”(see note 3) end up supporting? Overwhelmingly (90%) they went for Clinton, while the other 10% mostly went for Jill Stein or remained undecided.
Students who supported Kasich, Rubio, Cruz, or any other Republican candidate who lost during the primaries also had to pick a new candidate. Unlike Bernie fans, however, this bloc of students did not stick together for the general election – 42.4% eventually voted for Clinton, 30.3% for Trump, 11.1% for Johnson, and 16.2% still weren’t sure by voting time (meaning they probably didn’t vote).
Table 1 – How Students’ Primary Support Translated into a General Election Selection
|
||||||||||||||||||||||||||||||||||||||||||
Conclusion
This election and the results of this survey go to show that you can’t always assume how someone voted based off what you see or know. Clearly, not every Republican voted for Trump. But look even further – not every woman voted for Clinton, not every Sanders supporter was willing to listen when he endorsed Clinton, and plenty of students who are against abortion still opposed Trump (30% in fact). While party, gender, and other outward characteristics can say a lot about how someone might vote, there is so much more – personality, attitude, who they initially supported in the primaries – that leads to how someone ends up voting in November. Each of these moving parts play a role, yet it is up each individual to decide what the biggest and most important piece of the puzzle is. We as individuals – not our party or ideology – have the ultimate agency in determining how we will vote.
Oliver Gladfelter is a huge advocate of procrastination and spends most of his time finding new ways to waste time. He also studies political science on the side.
Notes
1. The national figures in a recent survey of Prof. Djupe’s were .27 among Democrats (compared to .19 at Denison), .33 among independents (.36 here), and .42 among Republican identifiers (.46 here).
2. For students not identifying within the traditional gender binary, none are Republicans, and 100% of those students who identify as Democrats voted for Clinton, so there is no variation.
3. “Bernie Bros” may be a fun phrase to say and write, but at least at Denison there was no male-female gender statistical difference in his support – he earned 42% of men’s support, 46% of women’s, and 63% of those with other genders.

3 Comments Add yours